Note: Before you study this section, you should know about the Gaussian or Normal probability distribution. Go here to learn more.
Using the tools of the Normal (Gaussian) distribution
In another section, we developed some tools that applied to the Normal or Gaussian distribution. They were
- mean $(\bar x \; \text{ or } \mu)$ and standard deviation $(\sigma)$ which locate the center of the distribution and specify its width, and
- the Z-score, which locates a point in the domain of the distribution in terms of the number of standard deviations away from the mean.
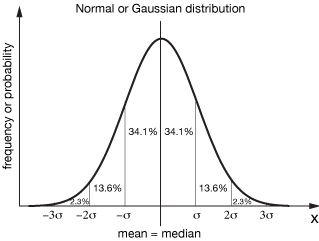
In addition, we discovered that the mean plus or minus one standard deviation $(\bar x ± \sigma)$ encloses about 68% of the total area under the Gaussian curve,
which means that there is a 68% chance that any measurement or further measurement conducted in the same manner would lie between $\bar x - \sigma$ and $\bar x + \sigma$. Likewise, $\bar x ± 2 \sigma$ and $\bar x ± 3 \sigma$ enclose 95% and 99.7% of the total probability, respectively.
These were handy tools, but they're of little use (at least directly) when we work with a distribution that is not Normal.
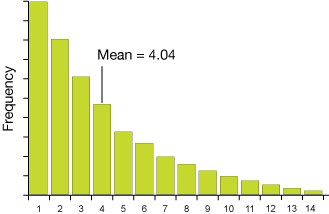
Here's an example, a distribution that looks more or less like an exponential decay — very non-Gaussian. The mean and standard deviation as we used them for a Normal distribution have a different meaning (or are meaningless) for such a skewed distribution.
But there is hope, as we shall see ... in the Central Limit Theorem.
The Central Limit Theorem is the basis of why we can do many of the statistical analyses we do. In brief, it says that no matter what the population distribution looks like, if we take enough random samples from it (provided they meet all of our conditions for good sampling), the distribution of the sample means or sample proportions (the sampling distribution) will be approximately normal, and will actually tend more and more toward normal as we add samples.
It might be useful to use an extreme example. Let's first construct an odd distribution like the exponential decay distribution we alluded to above. It might look like this:

This is clearly not a normal distribution. We've chosen the function $f(x) = e^{-0.25x}$. Now we'll take 1000 samples using x-values from 1 to 10 and distribute them accordingly:

The mean and standard deviation are $3.62 ± 2.48$, as calculated from the table of values and probabilities of this discrete random variable below.
![]()
Now let's generate a bunch of random samples of 100 values from this distribution. I used a little Python program to do that. It's basically an array of 241 1's, 188 2's, and so on, then random samples of some size are drawn from that – with replacement. Normally we'd choose our samples without replacement, but the error will be small in this case, and we'll still be able to prove our point.
Here is a histogram of the results of averaging samples of 30 draws from our distribution. 100 such samples were made. Both a normal distribution (gray curve) and our exponential decay (red curve) are sketched on the histogram. We can see that the distribution has some of the characteristics of both. It's not a great looking normal curve and it still looks a little like an exponential decay.

Here's what happens when we take 100 samples of 100 individual members of the population. Now the curve looks a lot more normal in shape, and the average of the samples is 3.60, very close to the population mean.

We can't add any more individuals to these samples because they're already at the 10% limit (though our replacement scheme really takes care of that here), but we can average a few more samples. This histogram shows the result of plotting 200 samples of 100 individuals each. It looks even better (more of a normal curve), and the mean is right on our population value of 3.63.

This little example is not a proof of the Central Limit Theorem, but it's a convincing example. Despite a population distribution that was anything but normal, when we took a number of well-constructed random samples and plotted its distribution, it got closer to normal in form and better at reproducing the population mean as our sample size and number of samples increased.
Central Limit Theorem
If enough samples are taken from any population distribution, even if it is not normal, the distribution of sample means or proportions will tend toward normal as we increase the sizes and number of those samples.
The advantage that this gives us is that we can use the tools we've learned from normally-distributed data to analyze nearly any data set, so long as our sampling is well-constructed.
Most events that depend on random chance ultimately tend to conform to a normal or Gaussian distribution. For example, if we measured the heights of all 25 year-old males in America, we'd come up with an average, and all other heights would be normally distributed around them, like this:

Think about it: If we measure just two heights and plot them, that's just two points and our "distribution" of heights won't look anything like that purple curve. But as we measure more and more 25 year-olds, right up to the roughly 2-3 million 25 year-old males in the U.S., that distribution will get smoother and smoother, ultimately looking just like a normal distribution.
Furthermore, our distribution will look pretty smooth because with that many data points, we're going to see very small differences between one measured height and the next, say like 6'-0" and 6'+1/64". The distribution looks pretty continuous.
In the example below, we can see the same type of behavior in a discrete probability problem, the sum of two dice. If we toss two dice, we obtain one of 11 different sums between 2 and 12. There's only one way to get a 2 (1 and 1), but six ways to roll a 7 (1-6, 6-1, 5-2, 2-5, 4-3, 3-4). There are 36 different arrangements of the numbers of two dice if the order matters – say one is red and one is green. That means that the probability of rolling a 2 is 1/36, while the probability of rolling a 7 is 6/36 or 1/6.
In the graph below, the green circles show those exact probabilities. The gray curves are results for trials of two-dice throws of 100, 200 and 1000 throws, respectively, and the red curve represents 10,000 throws. Notice the considerable fluctuations from the expected values, but that when we do a very large number of trials (10,000), we get very close to the expected values.

Consequences of the Central Limit Theorem
Here are three important consequences of the central limit theorem that will bear on our observations:
- If we take a large enough random sample from a bigger distribution, the mean of the sample will be the same as the mean of the distribution.
- The same is true of the standard deviation (σ) of the mean. It will be equal to the σ of the larger distribution.
- A distribution of sample means, provided we take enough of them, will be distributed normally.
Below we'll go through each of these consequences in turn using the following set of data:
Take a binary situation: a population can choose one option ("yes") or the other ("no"). Let's say that 50% choose A and 50% choose B.
I generated 10,000 members of the population using a spreadsheet, where for each member of the population, 1 means "yes" and 0 means "no." The following examples come from considerations of that data set (see table below).
1. If we take a large enough random sample from a bigger distribution, the mean of the sample will be the same as the mean of the distribution.
In this little experiment, we'll draw some small and large samples from our list of 10,000 yes/no decisions. Remember, the average of the data is 50% "yes." The table on the right shows the average number of "yes" answers (1's) in variously-sized random samples taken from it, from 100 samples to 5000.
It's not surprising that choosing 5000 out of the 10,000 samples yields average "yes" responses of near 50%. The averages are only a little worse for 2500 or 1000 data-point samples. After all, that's still quite a bit of data. Even 100 point means are pretty close to the mean of the "parent" data set, particularly if we draw ten 100 point samples and average our results.
While this doesn't prove our assertion, it is a pretty good example of it at work.

2. If we take a large enough random sample from a bigger distribution, the standard deviation of the sample will be the same as the standard deviation of the distribution.
To illustrate this property, a table of 10,000 integers randomly generated between 1 and 100 was constructed in a spreadsheet. The mean and standard deviation of all numbers was 49.85 ± 29.03.
Ten non-overlapping 1000 number samples were then taken from that same data, and averages and standard deviations were calculated. The table shows those averages and standard deviations, as well as the percent difference between the standard deviation for each subset and the whole data set. All of the sigmas are within 3% of the whole-set sigma.
This result also illustrates point #1 quite nicely; all of the means are very close to the mean of the whole set.

3. A set of sample means, if we take enough of them, will be distributed normally.
Using the distribution of 5000 yes/no results (#1 above), 50 different, non-overlapping 100-sample means were calculated. Those results were sorted into the histogram shown here. You can see that these means are beginning to approximate a normal distribution. The purple normal distribution is overlayed just for comparison.


![]()
xaktly.com by Dr. Jeff Cruzan is licensed under a Creative Commons Attribution-NonCommercial-ShareAlike 3.0 Unported License. © 2012-2025, Jeff Cruzan. All text and images on this website not specifically attributed to another source were created by me and I reserve all rights as to their use. Any opinions expressed on this website are entirely mine, and do not necessarily reflect the views of any of my employers. Please feel free to send any questions or comments to jeff.cruzan@verizon.net.