Rational Functions: ratios of polynomials
The root of the word "rational" is "ratio." Rational functions are ratios of polynomial functions, like the examples below.
What makes the graphs of rational functions so interesting (and tricky) is that they can have zeros (roots) in the denominator (remember, we can't divide by zero). Rational functions can also have strange behavior as the independent variable gets very large. And rational functions can even have "holes," points that are just missing from the domain and the graph.
Rational functions
Rational functions are ratios of polynomial functions,
$$f(x) = \frac{p(x)}{q(x)},$$
where $p(x)$ and $q(x)$ are polynomial functions, and $q(x) \ne 0$.
Functions that "blow up"
What makes the graphs of rational functions so strange and interesting (and useful for modeling real things) is that they can have zeros in the denominator, values of the independent variable that cause the denominator to equal zero, and thus cause what we will call asymptotic (silent p) behavior. When the denominator is zero, mathematicians sometimes say that the function "blows up."
Parent function
The parent function of all rational functions, the simplest that can be written, is $f(x) = 1/x$. It's graph is actually a curve called a hyperbola, but not all rational function graphs are hyperbolas. Here are some examples. Notice that each is composed of a polynomial function in the numerator and the denominator (we consider a constant a polynomial function of zero-degree):
$$f(x) = \frac{1}{x}$$
Simplest (parent)
$$g(x) = \frac{3x}{2x + 1}$$
$$h(x) = \frac{2x^2 - 2x + 7}{9x - 5}$$
Features of rational functions
| Term | Definition |
|---|---|
| Continuity & discontinuity | A function is continuous if we can draw its graph without lifting the pencil. Vertical asymptotes and holes are discontinuities. We'd have to lift the pencil and start drawing again at those points. Polynomial functions, by contrast, are always continuous. |
| Vertical asymptote | A vertical asymptote [ass'·im·tōt, silent p] (VA) is a result of a zero or root in the denominator of a rational function. At a vertical asymptote, the graph of the function rises or falls steeply to ± infinity $(\pm \infty)$. |
| Horizontal asymptote | A horizontal asymptote is present when the limit of the function as the independent variable ($x$) goes to infinity has a finite value. For For example, the limit of the function $f(x) = 1/x$ tends toward zero as $x \rightarrow \infty$ , but it never actually gets to zero. |
| Hole | A hole is a single point in the graph of a rational function at which the function has an infinite value. The function is not continuous at a hole. Holes are caused by the presence of an identical zero or root in both the numerator and denominator of a rational function. |
| Zero or root | Rational functions have zeros (roots), points where the graph crosses the $x$-axis, or $f(x) = 0$, just like polynomial functions. The zeros of a rational function are the zeros of the numerator; they don't depend on the denominator, unless there's a hole. |
Pro tip:
The zeros of a rational function are the zeros of the numerator. No fraction can equal zero unless its numerator is zero. Think about sixteenths: We can have 5/16, 1/16, and so on, but the only sixteenth that is zero is $\frac{0}{16} = 0.$
Asymptotes
The graphs of rational functions have strange features like asymptotes and holes. Collectively, these are called discontinuities, points (sometimes regions) that have to be left out of the domain because the function is infinite there.
The figure on the right shows the upper-right quadrant of the graph of $f(x) = 1/x$. We know that $x$ can never be zero, so zero doesn't appear in the domain, which is $(-\infty, \infty), \; x \ne 0$, which we also write as $(-\infty, 0) \cup (0, \infty)$. We say that $x = 0$ is the location of a vertical asymptote.
When $x$ is near zero, the function grows very rapidly. Sometimes mathematicians call this "blowing up" ... the function blows up at $x = 0$. This kind of asymptotic behavior is always seen next to vertical asymptotes.

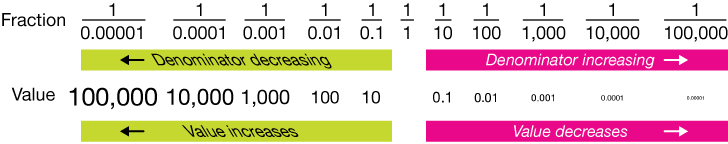
As denominator ↑, function ↓
Remember that as the denominator of a fraction grows (with a fixed numerator), the value of the fraction decreases, and as it shrinks, the fraction increases. That's all you need to know to understand the behavior of functions at asymptotes. Here's an example:

Another visual helper
Here's another graphic to help remind you how the value of a fraction changes as the denominator shrinks and grows:
Vertical and horizontal asymptotes
The full graph of the simplest rational function, $f(x) = 1/x$, is shown below. Notice that we see asymptotic behavior on both sides of the vertical asymptote at $x = 0$. Notice the symmetry of the function: when $x \lt 0$, $f(x) \lt 0$, and when $x \gt 0$, $f(x) \gt 0$. It's always useful to consider the symmetry of a function before drawing its graph.
Now consider what happens to $f(x)$ as $x \rightarrow \pm \infty$: 1/1, 1/10, 1/100, 1/1000, ... The value of $f(x)$ gets smaller and smaller as the value of $x$ increases. It approaches zero but never quite gets there. That's asymptotic behavior at a horizontal asymptote, $y = 0$.
Later we'll see that asymptotes can take the form of slanted lines or even curves like a parabola.
Asymptotes
An asymptote is an imaginary line or curve that the function graph approaches as the independent variable changes, but never quite reaches.
- Find vertical asymptotes by finding the real zeros of the denominator.
- Find horizontal asymptotes by thinking about the behavior of the function as $x$ approaches $\pm \infty$.

Always consider the symmetry
When the denominator of our parent function is squared, the function cannot take on negative values, so the left side gets reflected across the x-axis. $f(x)$ is positive no matter what the sign of $x$. Another way to say this is that $f(x) = 1/x^2$ is an even function.
The function $f(x) = 1/x^2$ still has a vertical asymptote at $x = 0$ because we can't have a zero denominator, and it still has a horizontal asymptote at $y = 0$ because as $x \rightarrow \pm \infty$, the value of the function approaches a limit of zero.


Here is another example of the kind of symmetry you might find in the graph of a rational function. In this case, $f(-x) = -f(x)$, so this is an odd function. The denominator is always positive because the only instance of $x$ is $x^2$, but the numerator takes on whatever sign the independent variable has, so this function is negative when $x \lt 0$ and positive when $x \gt 0$
Also notice that the denominator of this function has no real roots, therefore the function has no vertical asymptotes. The horizontal asymptote is $y=0$.
Finding horizontal asymptotes
Horizontal asymptotes are found by asking the question: What happens to the function as $x$ grows very large (goes to infinity) in both directions? Finding these is a different kind of mathematical exercise than you might be used to because it's not exact. Look at the first example below and follow the steps: First, when $x$ is very large, the constant terms (+2 and -1) will hardly matter, so we strike them. What's left
is just $x/x$, which tends to get closer to one as $x$ increases. Thus, our horizontal asymptote is the line $y = 1$.
Try to follow the second example, too. When the degrees (highest powers of $x$) of the numerator and denominator are the same, see how the horizontal asymptote is the ratio of their coefficients.
$$ \require{cancel} f(x) = \frac{x + 2}{x - 1} \color{#E90F89}{\rightarrow} f(x) = \frac{x + \cancel{2}}{x - \cancel{1}} \color{#E90F89}{\rightarrow} f(x) = \frac{x}{x} = 1 \color{#E90F89}{\rightarrow} \lim_{x\to\infty} f(x) = 1$$
when $x$ is large enough, the "canceled" constants won't matter.
$$g(x) = \frac{3x + 2}{x - 1} \color{#E90F89}{\rightarrow} g(x) = \frac{3x + \cancel{2}}{x - \cancel{1}} \color{#E90F89}{\rightarrow} g(x) = \frac{3 \cancel{x}}{\cancel{x}} \color{#E90F89}{\rightarrow} \lim_{x\to\infty} g(x) = 3$$
Degree of numerator < degree of denominator
In the examples below, the degree of the numerator is smaller than the degree of the denominator. That means that as x grows, the denominator will grow faster than the numerator, and by analogy with the function f(x) = 1/x, the horizontal asymptote will be at y = 0.
$$ \require{cancel} f(x) = \frac{x + 2}{x^2 - 1} \color{#E90F89}{\rightarrow} f(x) = \frac{x + \cancel{2}}{x^2 - \cancel{1}} \color{#E90F89}{\rightarrow} f(x) = \frac{x}{x^2} = \frac{1}{x} \color{#E90F89}{\rightarrow} \lim_{x\to\infty} f(x) = 0$$
$$g(x) = \frac{3x^2 + 2x + 1}{x^3 - 1} \color{#E90F89}{\rightarrow} g(x) = \frac{3x^2 + 2x + \cancel{1}}{x^3 - \cancel{1}} \color{#E90F89}{\rightarrow} g(x) = \frac{3x^2 + 2x}{x^3}\\ \color{#E90F89}{\rightarrow} g(x) = \frac{3x + 2}{x^2} \color{#E90F89}{\rightarrow} g(x) = \frac{3x + \cancel{2}}{x^2} \color{#E90F89}{\rightarrow} g(x) = \frac{3x}{x^2} = \frac{3}{x} \color{#E90F89}{\rightarrow} \lim_{x\to\infty} g(x) = 0$$
Degree of numerator > degree of denominator
Slanted and curved asymptotes
In the example below, the degree of the numerator is larger than the degree of the denominator. That means that as $x$ grows, the numerator will grow faster than the denominator, thus the function value, whether positive or negative, will grow "without bound."
What would otherwise be a horizontal asymptote, in these cases becomes a slanted line or another curve, such as a parabola.
To find the equation of such an asymptote, we just divide the smaller denominator into the larger numerator using polynomial long division. You need not worry about the remainder, although it does have a meaning: It is the vertical distance between the rational function graph and the curved asymptote as a function of $x$. Note that in the case of the slant asymptote below, this distance, too, approaches zero as $x$ increases, just as we would expect of an asymptote.

Asymptote guidelines
| Degree of numerator vs. degree of denominator |
Form of asymptote |
|---|---|
| Degree of numerator $\lt$ degree of denominator | Horizontal asymptote at $y=0$ |
| Degree of numerator $=$ degree of denominator | Horizontal asymptote at $y=$ the ratio of the leading coefficients |
| Degree of numerator $\gt$ degree of denominator | Asymptote of the same degree as the difference between the degree of the numerator and denominator. If the difference is 1, the asymptote is linear and may be slanted. If the difference is 2, the asymptote is parabolic, and so on. |
Limits at infinity: A new notation
As you move through mathematics, you'll encounter limits more frequently, so this is a good time to introduce limit notation. This will be especially useful when you study calculus. We are finding a limit when we ask, "how does this function behave as $x \rightarrow \infty$.
The table below shows limit notation in a number of circumstances. You'll definitely need to know limit notation to do calculus, and a bit of statistics, so it's good to try to wrap your head around it now.
| Expression | Interpretation |
|---|---|
| $$\lim_{x\to\infty} \; f(x) = a$$ | The limit of $f(x)$ as x approaches infinity is a. |
| $$\lim_{x\to\infty} \; f(x) = \frac{1}{4}$$ | The limit of $f(x)$ as x approaches infinity is b. |
| $$\lim_{x \uparrow \infty} \; f(x) = b$$ | The limit of $f(x)$ as x approaches infinity from below is b. |
| $$\lim_{x \to {\infty}^-} \; f(x) = b$$ | The limit of $f(x)$ as x approaches infinity from below is b. |
| $$\lim_{x \downarrow \infty} \; f(x) = b$$ | The limit of $f(x)$ as x approaches infinity from above is b. |
| $$\lim_{x \to {\infty}^+} \; f(x) = b$$ | The limit of $f(x)$ as x approaches infinity from above is b. |
Roots
The zeros of the numerator are the zeros of the function
To find the zeros of a rational function, we need only find the zeros of the numerator. Here's an example:

This function has a horizontal asymptote at $y = 1$, and three vertical asymptotes at $x = ±2$ and 4. It has three real roots at $x = ±3$ and $x = 5$. It's a complicated graph, but you'll learn how to sketch graphs like this easily, so not to worry.
To find roots or zeros of such a function, we do what we always do and set the function equal to zero. The function is
$$g(x) = \frac{(x + 3)(x - 3)(x - 5)}{(x + 2)(x - 2)(x - 4)}$$
... and we're trying to solve:
$$\frac{(x + 3)(x - 3)(x - 5)}{(x + 2)(x - 2)(x - 4)} = 0$$
To do so, we multiply both sides by the denominator, but because we multiply by zero on the right (and we always would), we end up simply solving for the zeros of the numerator.
$$ \begin{align} &\cancel{(x+2)(x-3)(x-5)} \frac{(x+3)(x-3)(x-5)}{\cancel{(x+2)(x-2)(x-4)}} \\[5pt] &= 0 \cdot (x+2)(x-2)(x-4) = 0 \end{align}$$
Holes
There is one last discontinuity of rational functions to discuss, the hole. We already know that if a zero occurs in the denominator of a function, we'll see asymptotic behavior at that point — a vertical asymptote will exist in the graph. But what if the same zero also appears in the numerator of the function?
Holes occur in a rational function when the same binomial, $(x - a)$, for example, exists in both the numerator and denominato. In such a case, while it's true that as $x \rightarrow a$, the denominator approaches zero, so does the numerator, and at exactly the same "rate." The net result is that the function looks quite normal, without a vertical asymptote at $x = a$, but of course the function cannot have a value at $x = a$, so there's a "hole" there. Here is an example:
Another way to think about holes is that the two identical binomials divide to one, so the function graph really doesn't depend upon them, and is really the graph of the simplified function, except that it still can't have a value at $x = a$, thus the hole.
Here's the graph of our function – we just indicate the hole with an open circle at its location.

When you study calculus, holes will be known as "replaceable discontinuities." While the hole is truly a discontinuity (strictly speaking, you'd have to pick your pencil up at the hole to draw the function), we can really just divide the repeated binomial away and use the resulting simpler function for most work.
Putting it all together
We've discussed all of the tools you need to analyze and sketch the graph of most rational functions. You might wonder why you need to do this if there are computers and programs that will graph a function for you. Here's why: computers can by mis-programmed, and therefore give misleading output (garbage in - garbage out).
I want you to be the person in the room who looks at a bad graph and says, "wait a minute, I don't think that can be right ..." Know roughly what you should get before you go to the computer. Let the computer do what it does best, fill in the details.
Here are some guidelines for sketching the graphs of rational functions:
Guidelines for graphing rational functions
| 1. | Factor the numerator to find the real zeros of the function. |
| 2. | Factor the denominator to find the real zeros of the denominator, which will be the locations of the vertical asymptotes. |
| 3. | Look for binomials common to the numerator and denominator; these, if any, will be holes in the graph, and no longer count as vertical asymptotes. |
| 4. | Find the limit of the function as x approaches ± infinity to find the horizontal asymptote(s). If the degree of the numerator is smaller than that of the denominator, the limit is zero. If it's larger, use long division to find the slant or curved asymptote. |
| 5. | Find the y-intercept, f(0). |
| 6. | Sketch the asymptote(s) and plot the y-intercept and any x-intercepts on your graph. |
| 7. | Consider any symmetry elements that might help you plot the graph. |
| 8. | Sketch the function graph by process of elimination, and by checking a few points, if necessary. |
Example 1
First we'll take a look at the numerator. There's no need to try to factor this one if we remember the discriminant:
$$b^2 - 4ac \lt 0$$
Because the discriminant is less than zero in this case, the numerator has no real roots (zeros), therefore this function has no roots and its graph never crosses the x-axis. That's good information.
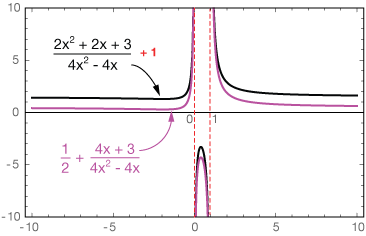
$$f(x) = \frac{2x^2 + 2x + 3}{4x^2 - 4x}$$
Numerator: no real roots
Now we can look for a horizontal asymptote by asking how the function behaves when $x$ grows very large, in either the positive or negative directions. First, for large $x$, the 3 in the numerator is virtually meaningless; we'll cross it out:
$$\lim_{x \to \pm \infty} \; \frac{2x^2 + 2x + 3}{4x^2 - 4x}$$
Now every remaining term can be divided by $x$, and the resulting integers are also of no value, so the limit is 1/2.
$$= \lim_{x\to \pm \infty} \frac{2x + \cancel{2}}{4x - \cancel{4}} = \frac{1}{2}$$
The denominator factors easily and has two roots at $x = 0$ and $x = 1$, the locations of our two vertical asymptotes.
$$ \begin{align} 4x^2 = 4x &= 0 \\[5pt] 4x(x - 1) &= 0 \end{align}$$
We need to know what happens between these asymptotes. The function could be above or below our horizontal asymptote. Plugging in 1/2 for $x$ gives us
$$f\left( \frac{1}{2} \right) \lt 0$$
That's all of the information we need to plot this function. See the magenta curve in the graph below. Finally, plotting of a couple of well-selected points shows that the function approaches the horizontal asymptote from below on the left and from above on the right.
Another way . . .
We could do this problem another way, too. It's sometimes possible to greatly simplify a rational function by doing the division it prescribes:
$$ \require{enclose} 4x^2 - 4x \enclose{longdiv}{2x^2 + 2x + 3}$$
The divisor goes in 1/2 times:
$$ \require{enclose} \frac{1}{2} \\ 4x^2 - 4x \enclose{longdiv}{2x^2 + 2x + 3}$$
One round of this division gives us a remainder of 4x + 3,
$$ \require{enclose} \frac{1}{2} \\[5pt] 4x^2 - 4x \enclose{longdiv}{2x^2 + 2x + 3} \\[5pt] \phantom{0000}\underline{-(2x^2 - 2x)} \\[5pt] \phantom{000000}4x + 3 $$
and the function can then be rewritten as a simpler rational function plus a constant, which just happens to be the horizontal asymptote.
$$ \begin{align} f(x) &= \frac{2x^2 + 2x + 3}{4x^2 - 4x} \\[5pt] &= \frac{1}{2} + \frac{4x + 3}{4x^2 - 4x} \end{align}$$
The plot below shows the original function and this new function plotted on the same graph. The original function has been artificially elevated by 1 unit so you can see that they're both the same.
Example 2
Sketch the graph of $f(x) = \frac{x - 2}{x^3 - 1}$
The purpose of this problem is to illustrate an important point, mentioned in the pro tip below.
$$ \begin{align} x^3 - 1 &= 0 \\[5pt] x^3 &= 1 \\[5pt] x &= 1 \end{align}$$
This equation has two non-real roots, of course, but they won't contribute to our graph.
The horizontal asymptote is found by inquiring about the limit of the function as $x\rightarrow \infty$:
$$\lim_{x\to ±\infty} \frac{x - 2}{x^3 - 1} = \lim_{x\to ±\infty} \frac{1}{x^2} = 0$$
This is true for any rational function in which the degree of the denominator is larger than the degree of the numerator. Notice that when x is large, the -1 and -1 don't really matter, then we can simplify to $\frac{1}{x^2}$. Finally, the y-intercept of our graph is $f(0) = 2$. Now we can sketch its graph:

Now you might have noticed one surprising thing about this graph: It crosses the horizontal asymptote (green dot in the graph). This can be troubling for students just learning about rational functions. After all, the no-crossing-vertical-asymptotes rule is strict. The function simply has no value at a vertical asymptote. Horizontal asymptotes are different.
Consider the question that we ask when finding the HA: what is the behavior of the function when the independent variable gets very large, either in the + or - direction? Notice that we are not asking what happens in the middle. In fact, many functions such as this example, cross the horizontal asymptote before eventually "settling in" to a gentle approach to the limit.
Pro tip: It's OK for a rational function, f(x), to cross a horizontal asymptote where x is relatively small. When we find horizontal asymptotes, we're asking the question, "what happens to the function when x is large?," not what happens in between.
Example 3
Sketch a graph of the function $f(x) = \frac{2x^2 - 6}{x^2 -2x - 8},$ labeling all roots and asymptotes, if any, and the y-intercept.
$$ \begin{align} 2x^2 - 6 &= 0 \\[5pt] x^2 &= 3 \\[5pt] x &= ± \sqrt{3} \end{align}$$
Now if there are vertical asymptotes, they will be be at the zeros or roots of the denominator:
$$ \begin{align} x^2 -2x - 8 &= 0 \\[5pt] (x - 4)(x + 2) &= 0 \\[5pt] x &= -2, \, 4 \end{align}$$
The horizontal asymptote is found by finding the limit of the function as $x \, \rightarrow \, ±\infty.$
$$ \begin{align} \lim_{x \to ±\infty} \; &\frac{2x^2 - 6}{x^2 -2x - 8} \\[5pt] &= \lim_{x \to ±\infty} \frac{2x^2}{x^2 -2x} \: \color{#E90F89}{\longleftarrow \, \text{constants don't matter}} \\[5pt] &= \lim_{x \to ±\infty} \; \frac{2x}{x - 2} \: \color{#E90F89}{\longleftarrow \, \text{cancel x's}} \\[5pt] &= \lim_{x \to ±\infty} \; \frac{2x}{x} \: \color{#E90F89}{\longleftarrow \, \text{constants don't matter}} \\[5pt] &= 2 \end{align}$$
So there is a horizontal asymptote at $y = 2$. It's important to remember that we asked the question, "What happens to $f(x)$ as $x$ gets very large (close to ∞)," not what happens when $x$ is much smaller, so our function could, in fact, cross the HA for smaller $x$.
Finally, it's usually very easy to find $f(0)$, the $y$-intercept:
$$f(0) = \frac{-6}{-8} = \frac{3}{4}.$$
That's all of the information we need to sketch a graph. A computer-generated graph is shown here, so it's got more detail than a hand sketch might show, but then it should — that's what computers are for.

Notice that the combination of the two roots and the $y$-intercept fix the general shape of the graph (the inverted U-shape) between the vertical asymptotes.
In the regions to the left and right of the vertical asymptotes, the yellow X's indicate regions where the function can't possibly be drawn because those curves would cross the x-axis, and we're out of roots. Notice that the curve to the left of $x = -2$, actually crosses the horizontal asymptote, then approaches it from below as $x \rightarrow -\infty.$ That's a detail your hand sketch might miss, but that's OK. Also note that extra "wiggles" like that are only possible if the function is sufficiently complicated in terms of the degrees of the numerator and denominator.
Video examples
Here are a few examples of sketching the graphs of rational functions.
1. Example 1
This function has a horizontal asymptote, but no vertical asymptote(s), and it has no real roots. You might think that would make it difficult to graph, but remember that knowing that something doesn't exist (like roots) is information, too.
2. Example 2
This function graph has two vertical asymptotes and a horizontal asymptote at y = 0. Notice that the graph crosses the horizontal asymptote as x = 0. That's OK. Remember that the question we ask when finding horizontal asymptotic behavior is "what does the function do when x gets very large, either in the negative or positive directions." We don't ask about what happens in between, and in fact a graph can cross that/those lines in between x = ±∞.
3. Example 3
This function also has two vertical asymptotes, but its behavior in between is a little different than the last example. The graph is totally consistent with the information we calculate and infer from the function.
4. Example 4
This graph has a hole at x = 3 because the binomial (x - 3) occurs both in the numerator and the denominator. That means when x → 3, the both of these binomials go to zero at the same rate. They divide to one (and thus have no effect on the graph) for all values of x except x = 3, and there the function is infinite. We say that there's a "hole" at x = 3; the function just has no value there. Later we'll refer to that kind of discontinuity in the graph as a "removable discontinuity."
Practice problems
Sketch graphs of these rational functions. Make sure to label asymptotes, holes, roots, y-intercepts and your axes.
-
$$f(x) = \frac{x}{(x + 2)(x - 2)}$$
Solution
$$f(x) = \frac{x}{(x+2)(x-2)}$$
Roots: The function has a value of zero only when x = 0, so that's our one root. This function only crosses the x-axis at x = 0.
VA: Vertical asymptotes are present when the denominator equals zero. This denominator is nicely factored, so $(x + 2)(x - 2) = 0$ when $x = ±2.$
HA: No real work is required to find the horizontal asymptote because it's easy to see that the degree of the numerator is 1 (x1) and the degree of the expanded denominator will be 2. That is, $(x+2)(x-2) = x^2 + \dots$
Because we have a root at x = 0, we already have the y-intercept. There isn't any obvious symmetry to exploit in this function.
The domain is divided into three regions: $x \lt -2,$ $-2 \lt x \lt 2,$ and $x \gt 2.$ In the first region, the function can't cross the x-axis, so it must remain entirely above it or below. If we check f(-3), the most convenient point to check, we find that the result is negative, so we know how to sketch that part of the graph. We can do the same thing for the right-most region, finding that f(3) is positive. In between the asymptotes, checking f(1) gives a negative result, so that's all the information we need.

-
$$f(x) = \frac{x^3 + 2x^2 - 5x + 2}{x^2 - x - 2}$$
Solution
$$f(x) = \frac{x^3 + 2x^2 - 5x + 2}{x^2 - x - 2}$$
Roots: The numerator of this function is cubic, so we expect to find three roots, though not all might be real. Using the rational root theorem, we find that one root is 1, reducing the polynomial to $(x - 1)(x^2 + 3x - 2).$ The quadratic part can be solved by completing the square, yielding two more roots. The roots are
$$x = 1, \, \frac{-3 ± \sqrt{17}}{2}$$
For graphing purposes, those last two roots are about 0.5 and -3.5.
VA: Vertical asymptotes are present when the denominator equals zero. This denominator is nicely factored to $(x - 2)(x + 1).$ So we have vertical asymptotes at x = 2 and x = -1.
HA: This function won't have a horizontal asymptote because the degree of the numerator is larger than the degree of the denominator. In fact, the difference is one unit, so we expect a slanted asymptote. To find it, we divide the denominator into the numerator and discard the remainder.*
$$ \require{enclose} \begin{array}{rll} x + 3\phantom{00000} \\[-3pt] (x^2 - x - 2) \enclose{longdiv}{x^3 - x^2 - 5x + 2}\kern-.2ex \\[-3pt] \underline{{-(x^3 - x^2 - 2x)} \phantom{000}} \\[-3pt] 3x^2 - 3x + 2 \phantom{0} \\[-3pt] \underline{-(3x^2 - 3x - 6)} \\[-3pt] 8 \phantom{0} \\[-3pt] \end{array}$$
So the equation of the slanted asymptote is $y = x + 3.$ It's plotted on the graph.
The domain is divided into three regions by the vertical asymptotes: $x \lt -1,$ $-1 \lt x \lt 2,$ and $x \gt 2.$ In the first region we have a root, so the function is "trapped" in the upper-left region. In the middle region there are two roots, so we'll have a U-shaped graph that opens either upward or downward. We know that the y-intercept is -1, so the graph will open downward. Finally, we need to check a convenient point on the right: f(3) > 0, so that part of the graph is "trapped" in the upper-right region. Here's our graph.

*The remainder of our long division,
$$y = \frac{8}{x^2 - x - 2},$$
is actually the vertical distance between the slanted asymptote and the function at any x value in the right or left regions of the graph.
-
$$f(x) = \frac{x^2 - 9}{x^2 - 4}$$
Solution
$$f(x) = \frac{x^2 - 9}{x^2 - 4}$$
Roots: The numerator of our function is a difference of squares, so it factors to $(x + 3)(x - 3),$ so our roots are x = ±3.
VA: The denominator is also a difference of squares, and it factors to $(x + 2)(x - 2),$ giving vertical asymptotes at x = ±2.
HA: The degrees of the numerator and denominator are the same, so the HA is the ratio of the coefficients of those terms, y = 1.
The y-intercept is at y = 9/4, and for this function, that's all the information we need to sketch a nice, unambiguous graph.

-
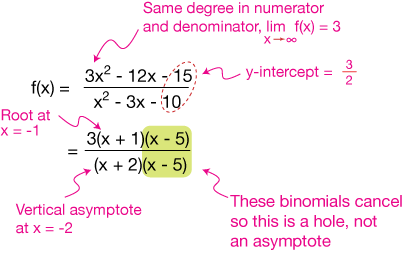
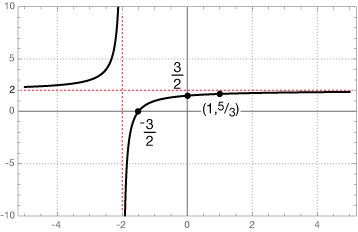
$$f(x) = \frac{(2x + 3)(x - 1)}{(x + 2)(x - 1)}$$
Solution
$$f(x) = \frac{(2x + 3)(x-1)}{(x+2)(x-1)}$$
The first thing to notice about this function is that the binomial (x - 1) appears both in the numerator and denominator. That means there will be a hole in the function at x = 1. A hole is a "replaceable discontinuity," which means we can replace this function entirely with
$$f(x) = \frac{2x+3}{x+2}.$$
All we have to do is draw that function, and make a note that there is a hole at x = 1.
Roots: The numerator of our "replacement" function is $2x + 1.$ Setting that equal to zero gives us one root at $x = -\frac{3}{2}.$
VA: The denominator of the replacement function is $x + 2,$ so there is a vertical asymptote at $x = -2.$
HA: The degrees of the numerator and denominator are the same, so the HA is the ratio of the coefficients of those terms, y = 2.
The y-intercept is at y = 3/2. We can use the replacement function to determine the y-coordinate of the hole; it's 5/3. Here's the graph:
-
$$f(x) = \frac{(x^3 + 1)(x + 1)}{x(x + 1)}$$
Solution
$$f(x) = \frac{(x^3 + 1)(x+1)}{x(x+1)}$$
First recognize that this function has a hole at x = -1.
If we expand what remains of the function, we get
$$f(x) = \frac{x^3 - 1}{x}.$$
Notice that the degree of the numerator is two more than the degree of the denominator, so this function will have a quadratic asymptote. If we do the easy long division, the asymptote (less the remainder) is $y = x^2.$
Roots: The numerator of our "replacement" function is $x^3 + 1,$ which has a root at x = -1, but this is at the x-coordinate of the hole, so we can assume the function has no real roots.
VA: The denominator of the replacement function is $x,$ so there is a vertical asymptote at $x = 0.$
Here's what the function looks like:
-
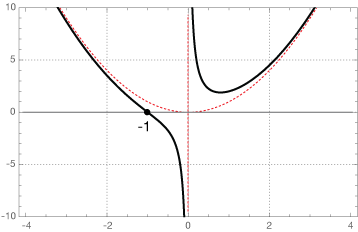
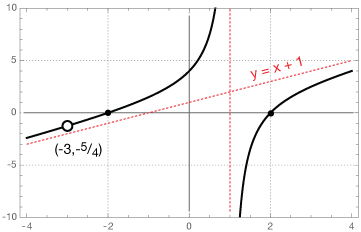
$$f(x) = \frac{(x^2 - 4)(x + 3)}{x^2 + 2x - 3}$$
Solution
$$f(x) = \frac{(x^-4)(x+3)}{x^2+2x-3}$$
When we expand the numerator and denominator, we get
$$f(x) = \frac{(x+2)(x-2)(x+3)}{(x+3)(x-1)}$$
Notice that $x = -3$ is a hole and we can replace our function with
$$f(x) = \frac{(x+2)(x-2)}{(x-1)} = \frac{x^2-4}{x-1}$$
Roots: The roots are now clearly $x = ±2.$
VA: There is one vertical asymptote at $x = 1$
There is a slanted asymptote obtained by dividing $x-1$ into the numerator. It's equation is $y = x+1.$ The graph looks like this:

![]()
xaktly.com by Dr. Jeff Cruzan is licensed under a Creative Commons Attribution-NonCommercial-ShareAlike 3.0 Unported License. © 2012-2025, Jeff Cruzan. All text and images on this website not specifically attributed to another source were created by me and I reserve all rights as to their use. Any opinions expressed on this website are entirely mine, and do not necessarily reflect the views of any of my employers. Please feel free to send any questions or comments to jeff.cruzan@verizon.net.