A valuable tool for probing electronic structure
Photoelectron spectroscopy (PES) is an important method for probing the energy-level structure of atoms and molecules. Each electron in an atom or molecule can be liberated from that molecule if provided with enough energy from electromagnetic (EM) radiation (light). If we can measure the amount of energy required to remove each electron, we can create an energy-level diagram of the atom, molecule or substance, and perhaps predict or manipulate its properties.
In general, radio and microwave frequencies (low frequency, long wavelength) correspond to
rotational energy level spacings of molecules. Of higher energy is infrared radiation, which generally corresponds to the spacings between vibrational energy levels supported by the bonding of atoms in molecules. Electrons bound to atoms and molecules have kinetic energies corresponding to ultraviolet (UV) and x-ray light, on the high-energy (short wavelength, high frequency) end of the EM spectrum.
There are two principal methods of PES, ultraviolet (UV) photoelectron spectroscopy (UPS) and X-ray PES (XPS). These are diagrammed and described below.
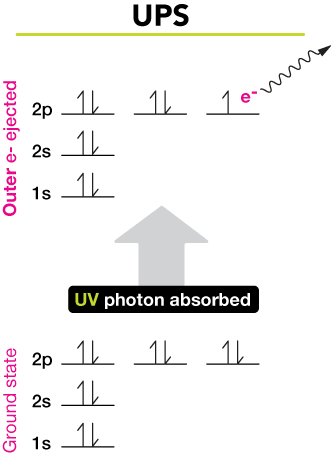
UV photoelectron spectroscopy (UPS)
Light of the energy of a UV photon is capable of providing outer-shell electrons with enough energy to escape an atom or molecule. The figure shows the electron configuration of a ground-state neon (Ne) atom (lower set of energy levels). Upon absorption of a UV photon of a specific energy, an outer (2p) electron can be liberated from the atom. That electron can be detected, and its energy can be determined.
The squiggly line indicates the bound electron becoming free and leaving the atom/molecule. The kinetic energy of electrons liberated from samples in this way can be measured, and in this way we can reconstruct the electronic energy-level diagrams of the substance.
Higher-energy UV radiation can match the binding energy of electrons just below the outer orbitals, but x-ray light is required to liberate electrons closer to the nucleus.
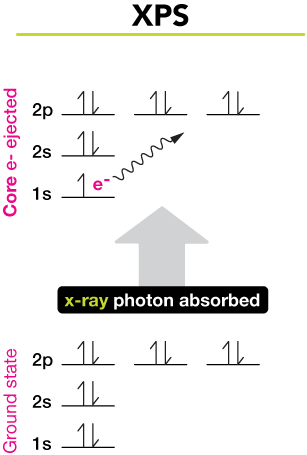
X-ray photoelectron spectroscopy (XPS)
The second method is x-ray photoelectron spectroscopy (XPS), shown here. When an atom or molecule is irradiated with high-energy x-ray photons, inner, or "core" electrons may receive enough energy to be liberated from the atom. In this case, a 1s core electron is liberated from a neon atom after absorption of an x-ray photon.
By varying the energy of x-ray photons, we can remove 1s, 2s, 2p, electrons, and so on. Each will require a fixed amount of energy, proportional to the energy of the x-ray light, and each will carry away a certain amount of kinetic energy as a free electron. From these two values, which can be measured, we can easily calculate the binding energy of each electron in the atom or molecule (see below for more).
spectroscopy
A branch of experimental science that concerns the interaction of electromagnetic radiation (light from radio waves to x-rays) and matter. Absorption of light, and subsequent excitation to higher levels of kinetic energy (electronic, vibrational, rotational or translational), and re-emission of lower-energy radiation are all clues to the energy-level structure of matter.
The basic PES experimental setup
The figure below shows the basic features of most photoelectron spectroscopy experiments. We'll describe the main features.
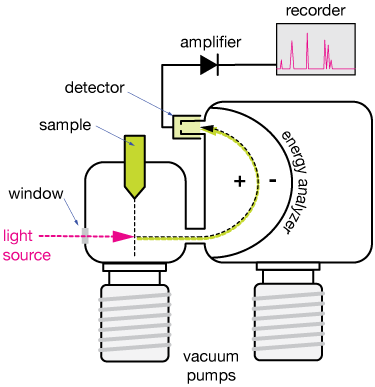
Sample
The sample can be a stream (called a beam) of gaseous particles, or a solid surface. In this case, a beam of particles is shown intersecting the light source at right angles.
Light source
The light source in a PES experiment is a UV or X-ray source. UV light can be generated using a helium lamp, but the intensity of such light sources isn't great for most modern experiments, which turn to laser sources for UV light, or to light generated by synchrotron sources for high-energy UV (VUV) or X-ray light.
The light passes through a window in a vacuum chamber. The whole experiment is generally run under high vacuum conditions so that atmospheric atoms and molecules don't interfere with collection and analysis of the freed electrons.
Energy analyzer
Any electron knocked out of an atom by the energy carried by the UV or X-ray light will have a certain kinetic energy, and that energy can be measured. The black/green dashed line shows the curved path of a photoelectron through the energy analyzer. The analyzer is a device in which electric fields can be adjusted to steer the negatively-charged free electrons into a detector. By scanning the electric fields, we can determine the kinetic energy of the ejected electron.
Because free electrons are discrete particles (or can behave that way under the right circumstances), we can also count electron impacts on the detector, so the intensity of the PES signal can be proportional to the number of electrons liberated from a sample. That will come in handy as we see how to analyze PES spectra below.
Detector
There are a few kinds of detectors, but for our purposes, just assume that the detector is capable of sending an electric signal to an amplifier paired with some sort of recorder, when an electron hits it. The detector signal is filtered for noise reduction, amplified and sent to a recording device to display and save the data.
Both the analyzer and the energy of the light source can be varied to produce and measure energies of a range of photoelectrons, and in this way we can determine the electronic energy levels of the atoms and molecules in the sample.
The energy analyzer of the PES experiment can determine the total kinetic energy of an emitted photon. That energy is a sum of the binding energy and any additional kinetic energy gained by the electron from excess energy (above the binding energy) from the light source.
The energy of a single photon of light of frequency ν (where ν is the Greek letter 'nu'), is
![]()
where h is Planck's constant,
![]()
The kinetic energy of an emitted photon, Ek, is then the difference between the photon energy and the binding energy of the electron
![]()
So by knowing the frequency of the incident light (which is usually easily), we can find the binding energy of each electron represented in the PES spectrum.
Units of energy & intensity
The most common unit of energy used in PES is the electron-Volt (eV). The eV is a product of the charge of an electron and the potential (voltage) across which it moves, or the work done in accelerating it across a potential difference of 1 V. One eV is also 1.6 × 10⁻¹⁹ Joules (J).
Because free electrons are discrete particles, they can be counted. The intensity (y-axis) scale of a PES spectrum generally represents the number of electrons at each energy detected.
The binding energy or ionization energy, Ei of an electron can be measured from its photoelectron (PES) spectrum, by subtracting the measured kinetic energy of the ejected electrons,Ek, from the photon energy, hν:
Ei = hν - Ek
The Greek alphabet
| alpha | Α | α |
| beta | Β | β |
| gamma | Γ | γ |
| delta | Δ | δ |
| epsilon | Ε | ε |
| zeta | Ζ | ζ |
| eta | Η | η |
| theta | Θ | θ |
| iota | Ι | ι |
| kappa | Κ | κ |
| lambda | Λ | λ |
| mu | Μ | μ |
| nu | Ν | ν |
| xi | Ξ | ξ |
| omicron | Ο | ο |
| pi | Π | π |
| rho | Ρ | ρ |
| sigma | Σ | σ |
| tau | Τ | τ |
| upsilon | Υ | υ |
| phi | Φ | φ |
| chi | Χ | χ |
| psi | Ψ | ψ |
| omega | Ω | ω |
Interpreting photoelectron spectra
The PES spectrum of neon (simulated) below, shows the main features of most PES spectra. In this spectrum the energy scale runs from right to left (lower to higher energies); that may be reversed in some spectra. UV radiation is generally defined as having photon energies up to 100 eV. x-rays have higher energies, up to 1000 eV (1 KeV) in this spectrum.
Photoelectron spectrum of neon (simulation)
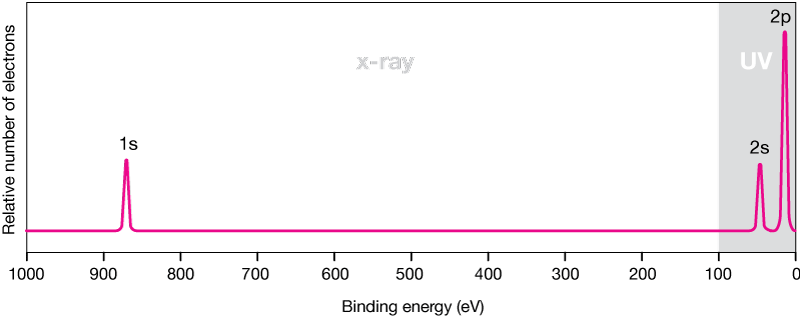
The inner-shell electrons are the most tightly bound, and require the most energy to ionize. The small peak at about 875 eV represents the two 1s electrons of Ne. The 8 electrons of the n = 2 shell are more weakly bound because they are farther from the nucleus, and shielded from it by the 1s electrons. They ionize at much lower energies. Notice that the height of the peaks is proportional to the number of electrons in the orbital. The 2p peak is three times the height of the 2s peak; it represents six electrons to the two in the 2s orbital.
Example
See if you can identify the chemical element depicted by this PES spectrum.


![]()
xaktly.com by Dr. Jeff Cruzan is licensed under a Creative Commons Attribution-NonCommercial-ShareAlike 3.0 Unported License. © 2012-2025, Jeff Cruzan. All text and images on this website not specifically attributed to another source were created by me and I reserve all rights as to their use. Any opinions expressed on this website are entirely mine, and do not necessarily reflect the views of any of my employers. Please feel free to send any questions or comments to jeff.cruzan@verizon.net.